
Why GIS Software for Emergency Management Is Critical for Modern Incident Response
Nov. 5th, 2026 12:00 pm
Every emergency happens somewhere, and geographic information system (GIS) technology shows your team exactly where and why. GIS software for emergency management turns addresses, hazards, and resources into maps that guide faster, smarter decisions. Without that spatial view, responders rely on radio descriptions and guesswork while conditions change around them.
In this article, you will learn how mapping builds situational awareness and which capabilities matter most. You will also see how to bring GIS into everyday operations so your team trusts it during emergencies. Every insight applies whether you protect a county, a campus, a utility service area, or a large public event.
What Is GIS Software for Emergency Management?
GIS software for emergency management is a mapping platform that displays incidents, hazards, resources, and infrastructure on interactive maps. It layers real-time data, such as weather, road closures, and unit locations, over the communities you protect. As a result, every responding agency shares one visual picture that speeds decisions during fast-moving incidents.
How GIS Software for Emergency Management Builds Situational Awareness
Situational awareness means knowing what is happening, where it is happening, and what might happen next. According to the U.S. Geological Survey (USGS), GIS analyzes and displays information tied to specific locations. GIS software for emergency management applies that power to incidents, giving every responder a shared view of the scene.
First, maps show exactly where damage, hazards, and calls for help cluster across your jurisdiction. Next, layered data reveals how flood zones, power outages, and road closures overlap with vulnerable populations. Then, live updates let your team track how conditions change from one operational period to the next.
According to the National Oceanic and Atmospheric Administration (NOAA), linking maps to data helps people see patterns and relationships. Spotting patterns early helps your team move resources before small problems grow into major ones.
Additionally, maps communicate faster than text, especially when leaders need to brief officials or the public quickly. A single map can show evacuation zones, shelter locations, and open routes in one glance. Consequently, everyone from elected leaders to field crews understands the situation without reading lengthy reports.
Key Capabilities Responders Need From Mapping Tools
Not every mapping tool fits the speed and pressure of emergency response operations. When you compare GIS software for emergency management, look for features built around real incidents, not just static maps. The strongest platforms deliver these core capabilities to every responding partner during an activation.

-
Real-time data layers: Live feeds for weather, traffic, outages, and unit locations that update without manual entry.
-
Common operating picture: One shared map that every agency views, whether in the operations center or the field.
-
Damage assessment tools: Mobile forms that pin photos and reports to exact locations as crews survey affected areas.
-
Hazard and risk overlays: Flood zones, critical facilities, and vulnerable populations shown together for faster planning decisions.
According to the Federal Emergency Management Agency (FEMA), its National Risk Index shares hazard data through GIS services for analysis. Bringing federal layers like that into your own maps adds valuable context to local planning. In turn, your team prioritizes mitigation and response efforts where community risk runs highest.
Mobile access matters too, since field crews need the same map view as your operations center. Look for tools that work on tablets and phones without requiring special training or software installs.
Meanwhile, your maps should connect with the incident records your team already manages. DLAN's capabilities tie mapping to tasks, resources, and reports, so every pin links to real response activity. As a result, your map becomes a working tool rather than a separate display on the wall.
Bringing GIS Software for Emergency Management Into Daily Operations
Teams trust tools they use every day, and maps are no exception during high-pressure incidents. Use GIS software for emergency management for routine work like planned events, exercises, and hazard planning. Daily use builds familiarity, so nobody fumbles with layers or logins when a real emergency begins.
Next, connect your maps to the data sources your partners already maintain, including 911, weather, and utility systems. Buffalo Computer Graphics (BCG) offers GIS and integration services that connect DLAN to those feeds automatically.
Then, add specialized layers for the hazards and events your community faces most often. For example, campus teams can map stadium gates, medical stations, and parking areas for game day operations. Similarly, plug-and-play toolkits add ready-made forms and dashboards that tie field reports to exact locations.
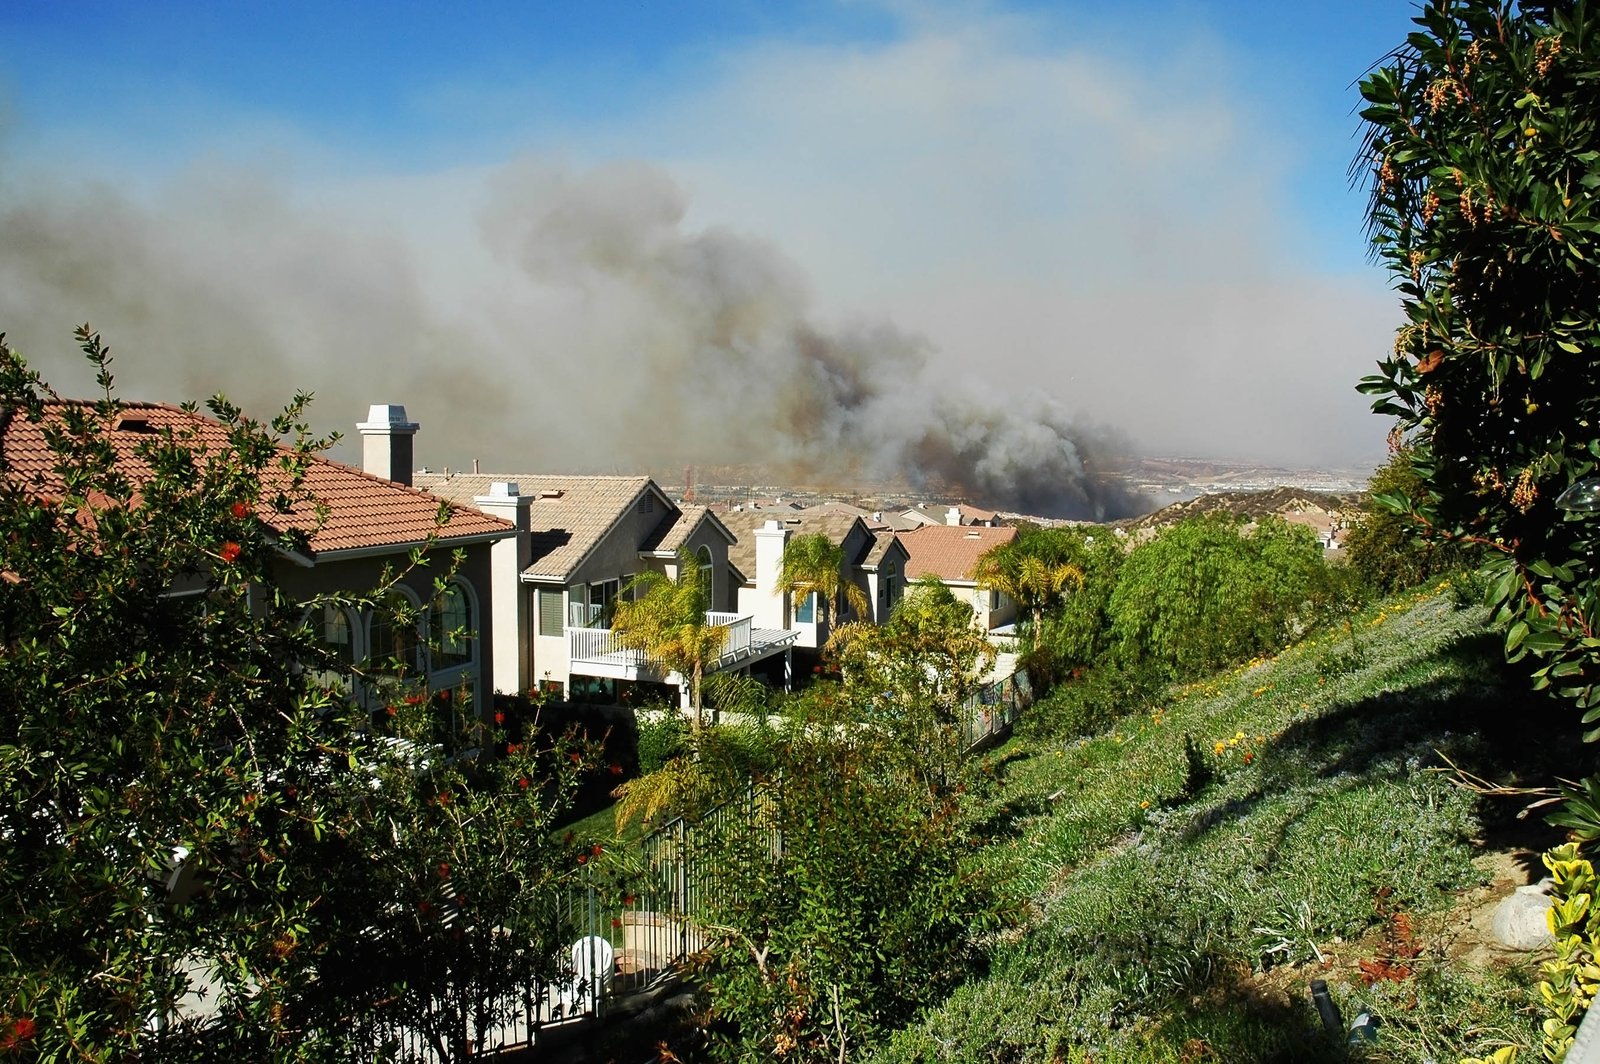
Picture a county facing a fast-moving wildfire as winds shift toward several rural neighborhoods. Because the fire perimeter, evacuation zones, and shelter capacity share one map, leaders adjust orders within minutes. Afterward, the recorded map history helps planners review every decision and refine evacuation zones.
Finally, train every user on the map tools tied to their specific role and responsibilities. BCG's role-based training helps staff read, update, and share maps with confidence during real activations.
Give Every Responder a Clearer Picture of the Incident
GIS software for emergency management turns scattered information into one clear picture every responder can act on. Still, maps only help when they connect to live data, daily workflows, and well-trained teams. The right partner brings those pieces together so your maps support decisions instead of decorating walls.
At BCG, our New York team builds DLAN and its integrations in-house, with emergency managers shaping every feature. You gain responsive experts, transparent terms with no hidden costs, and a partner invested in your community's safety. Reach out to our GIS team to see how live mapping can sharpen your next incident response.

